

JavaScript performance profiling in Chrome is identifying and analyzing the performance of a Javascript application or web page. This is an essential step in the development process as it helps developers understand the version of their application from a high-level perspective to pinpoint the exact lines of code causing the performance issue.
So let’s see how to set up the performance profiler.
Table of Contents
Setting Up the Performance Profiler
Before we can start JavaScript performance profiling in Chrome, we need to set up the performance profiler in Chrome. To do this, follow these steps:

1. Open Chrome and navigate to the web page or application you want to profile.
2. Use the F12 key to open the developer console.
3. Find the Performance tab in the console and click on it.
4. Click the Record button to start capturing performance data.
Capturing Performance Data
We can begin capturing performance data once the performance profiler is set up. To do this, interact with the web page or application as usual. This could involve clicking buttons, filling out forms, or performing other actions you want to profile.
As you interact with the page, Chrome captures performance data and displays it in the Performance tab. This data includes information about the overall performance of the page, as well as detailed information about individual resources, such as JavaScript files and images.
Analyzing Performance Data
After you have enough performance data, you can analyze it to locate any bottlenecks or issues. Do this by following these steps:
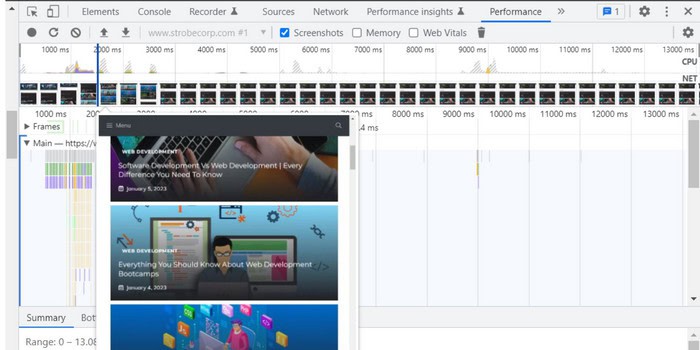
1. Stop recording performance data by clicking the Stop button in the Performance tab.
2. Review the overall performance data, paying particular attention to the Summary section at the top of the tab. This section displays vital performance metrics, such as the overall load time of the page, the number of resources loaded, and the amount of time spent in JavaScript.
3. Drill down into the detailed performance data by clicking on specific resources or events in the timeline. This will display more information about the resource or event, including its duration, size, and any errors that may have occurred.
4. Use this information to identify any performance bottlenecks or issues. Common issues include slow-loading resources, inefficient JavaScript code, and excessive DOM manipulation.
See also: Demystifying HTML No-Cache: How To Implement And Improve Performance.
Optimizing Performance
Once you have identified performance bottlenecks or issues using JavaScript performance profiling in Chrome, you can begin optimizing the performance of your web page or application. Some common strategies for improving performance include:
1. Optimizing images: Use image optimization tools to reduce the size of images without sacrificing quality.
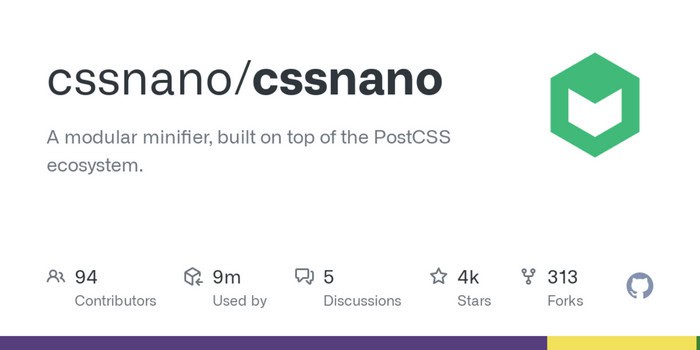
2. Minifying CSS and JavaScript: Use tools like CSSNano and UglifyJS to minimize the size of your CSS and JavaScript files.
3. Caching resources: Use caching techniques, such as HTTP caching and service workers, to store resources locally and reduce the number of network requests required to load the page.
4. Reducing the number of resources: Eliminate unnecessary resources, such as third-party libraries or large images, to reduce the overall size of the page.
By making performance a priority throughout the development process and following these steps, you can significantly improve the performance of your web page or application and provide a better user experience.
Also, see the best web development tools.
FAQs
How do I use the performance profiler in Chrome?
To use the performance profiler in Chrome, open Developer Tools (F12 or Ctrl+Shift+I), go to the Performance tab, click the Record button, interact with the webpage, then stop recording. Analyze the results to identify performance bottlenecks.
How do I add a profiler to Chrome?
Chrome's built-in Developer Tools already include a profiler. Access Developer Tools, go to the Performance tab, and use the built-in profiler to analyze webpage performance.
How do I show FPS in Chrome?
To display FPS in Chrome, access Developer Tools, go to the Rendering tab, and check 'Show FPS meter.' A real-time FPS counter will appear on the webpage.
Is 60 FPS good for gaming?
Yes, 60 FPS (frames per second) is generally good for gaming. It provides smooth gameplay and responsiveness, enhancing the overall gaming experience. While higher FPS can offer even smoother visuals, 60 FPS is a standard benchmark that balances performance and visual quality for most gamers.
Conclusion
JavaScript performance profiling in Chrome plays a vital role in the development process for ensuring efficient web application performance. Developers can improve the user experience by:
- Setting up the performance profiler
- Capturing performance data
- Analyzing the data for any bottlenecks or issues
- Implementing optimization strategies, such as minimizing the size of images and CSS/JavaScript files, caching resources, and reducing the number of resources on the page
If you have any additional questions or want more information on optimizing JavaScript performance profiling in Chrome, feel free to comment below. Bookmark strobecorp.com for more updates and tips on web development.