

Java is a popular programming language for building various applications, from the web and mobile apps to games and system software; however, like any other programming language. Java developers often encounter bugs and errors that can be frustrating to fix. And that’s where debugging tools for Java come in handy.
The 6 Best Java Debugging Tools are:
- Eclipse Debugger
- IntelliJ IDEA Debugger
- Java Debug Wire Protocol (JDWP)
- Java Platform Debugger Architecture (JPDA)
- JVisualVM
- FindBugs
- Log4j
- JUnit

Debugging is one of the essential skills for any software developer, and Java developers are no exception. Whether working on a small personal project or an extensive enterprise application, quickly and effectively finding and fixing bugs can save you time and frustration. So, let’s learn about these tools in detail.
Table of Contents
6 Best Java Debugging tools
Here are six Java debugging tools that every Java developer should know:
Eclipse Debugger
Eclipse is a popular Integrated Development Environment (IDE) for Java, with a built-in debugger. The Eclipse debugger lets you step through your code line by line, set breakpoints, inspect variables, and evaluate expressions. It also has features such as hot code replacement.
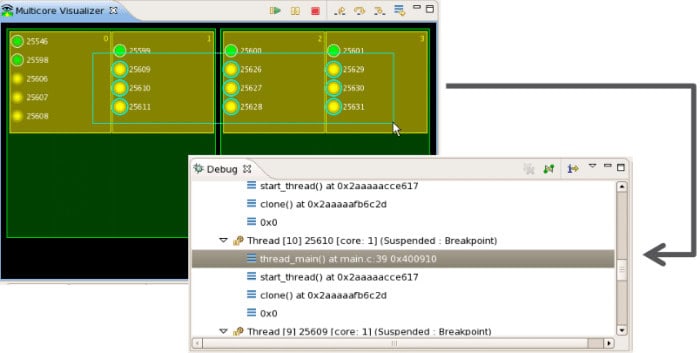
Which allows you to make changes to your code while the application runs and immediately see the results.
IntelliJ IDEA Debugger
IntelliJ IDEA is another popular IDE for Java, and it also comes with a built-in debugger. Like the Eclipse debugger, it lets you step through your code, set breakpoints, inspect variables, and evaluate expressions.
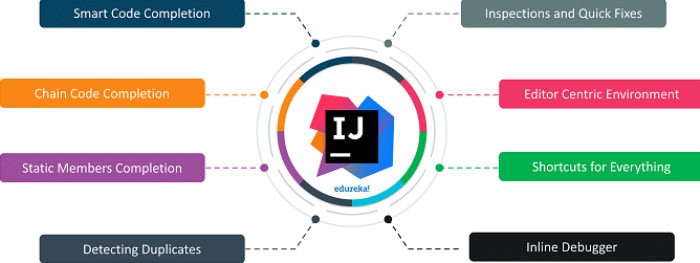
In addition, it has some advanced features such as “smart step into, ” which allows you to choose which method to step in when multiple methods call on a single line.
Java Debug Wire Protocol (JDWP)
The Java Debug Wire Protocol (JDWP) is a protocol that enables a debugger to communicate with a Java Virtual Machine (JVM). This allows you to debug a Java application remotely from a different machine or a different process on the same machine.

JDWP supports most Java IDEs, including Eclipse and IntelliJ IDEA, and also supports command-line tools such as jobs.
Java Platform Debugger Architecture (JPDA)
The Java Platform Debugger Architecture (JPDA) is a set of APIs that allow a debugger to attach to a Java application and control its execution.
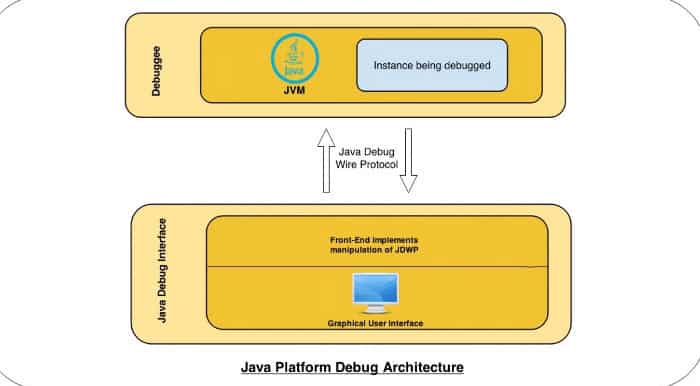
JPDA is the underlying technology that powers most Java debuggers, including Eclipse and IntelliJ IDEA.
JVisualVM
JVisualVM is a visual tool for monitoring and troubleshooting Java applications. It allows you to monitor the performance of your application, including CPU and memory usage, and to inspect the threads and memory heap.
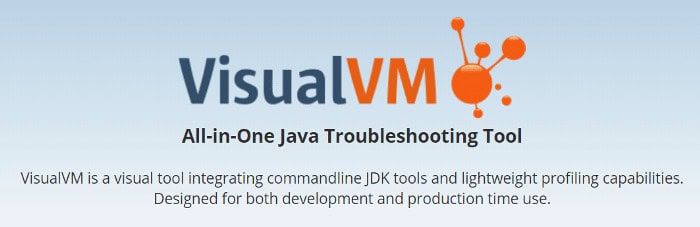
It also has a built-in profiler that can help you identify performance bottlenecks. JVisualVM is included with the Java Development Kit (JDK).
FindBugs
FindBugs is a static code analysis tool that can identify potential bugs in your Java code. It works by scanning your code and looking for patterns indicative of bugs, such as null pointer exceptions or infinite loops. FindBugs run from the command line or are integrated into your build process. They can be configured to ignore specific warnings or treat them as errors.

Some more debugging tools are:
Log4j
Log4j is a Java logging utility that allows developers to output log messages from their applications. It can be configured to output log messages to the console, a file, or a remote server.

By including log statements in their code, developers can use Log4j to trace the execution of their applications and identify problems.
JUnit
JUnit is a Java unit testing framework that allows developers to write and run automated tests for their code. By writing and running tests, developers can ensure that their code works correctly and identify potential problems. 
JUnit can be beneficial for debugging because it allows developers to test specific parts of their code in isolation, making it easier to identify problems.
FAQs
What are Java debugging tools?
Java debugging tools, used for identifying and resolving issues in Java programs, offer various features like breakpoints, variable inspection, and thread monitoring. Consequently, these tools enable developers to understand the code's behavior and efficiently locate bugs.
What is a breakpoint in Java debugging?
A breakpoint in Java debugging serves as a marker within the code where the execution pauses, granting developers the opportunity to inspect variables and thoroughly analyze the program's state. Once the execution reaches the breakpoint, the debugger halts, allowing developers to gain insights by examining variables. Then it steps through the code, and assesses the program's state.
What is the purpose of the Java debugger 'step over' command?
The 'step over' command in Java debugging is a valuable tool that executes the current line without delving into method calls. It empowers developers to maintain focus on the high-level flow of the program. Should the string contain a method call, the debugger executes it entirely without stepping into it. This makes it an efficient approach for swiftly navigating through method calls and emphasizing the program's overall flow.
What is the difference between 'step into' and 'step over' in Java debugging?
'Step into' and 'step over' are two different debugging commands: 'Step into' goes inside the method for debugging, while 'step over' moves to the following line, skipping method call details.
How can I inspect the value of a variable during Java debugging?
Inspect variable values in Java debugging by hovering over them (in some IDEs). An alternative is using the 'watch' or 'variables' window, which displays current values in the scope. Additionally, you can set watches on specific variables to monitor their importance throughout the debugging process.
Are there any command-line Java debugging tools?
Absolutely! Command-line Java debugging tools, such as jdb (Java Debugger), are readily available in the JDK. It is particularly beneficial in environments without graphical interfaces. While they might lack the same level of user-friendliness as IDE-based debugging. They prove to be invaluable assets for developers operating in such contexts.
Conclusion
In conclusion, debugging is an essential skill for any Java developer. And there are several tools available to help you find and fix bugs in your code. Debugging tools are an integral part of the Java development process. Whether you prefer a graphical debugger like Eclipse or IntelliJ IDEA or a command-line tool like Job, there is a tool that can meet your needs. Suppose you’re a beginner or an experienced developer. It’s essential to have a good understanding of the debugging tools available to you.
The tools discussed in this article are just a few debugging tools available to Java developers. But they are some of the most popular and powerful ones. By familiarizing yourself with these tools, you’ll be well-equipped to identify and fix problems in your Java code.
See Also: How To Choose The Interface Of A Website Properly? [Explained]